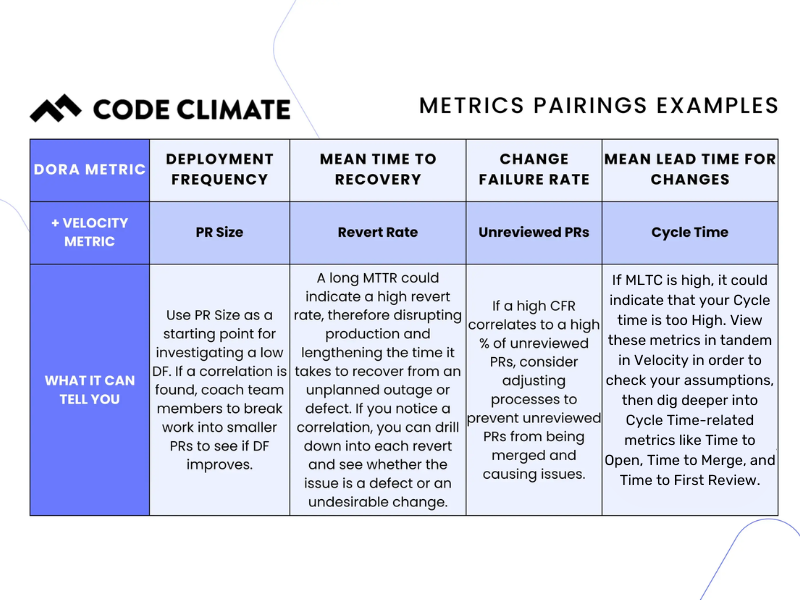
The four DORA Metrics — Deployment Frequency, Change Failure Rate, Mean Time to Recovery, and Mean Lead Time for Changes — were identified by the DevOps Research and Assessment group as the metrics most strongly correlated to a software organization’s performance.
These metrics are a critical starting point for engineering leaders looking to improve or scale DevOps processes in their organizations. DORA metrics measure incidents and deployments, which can help you balance speed and stability. When viewed in isolation, however, they only tell part of the story about your engineering practices.
To begin to identify how to make the highest-impact adjustments, we recommend viewing these DORA metrics in tandem with their non-DORA counterparts, which can be done through Velocity’s Analytics module. These close correlations will help are a great starting point if you're looking for opportunities to make improvements, or might highlight teams that are doing well and might have best practices that could scale across the organization.
While there is no one-size-fits-all solution to optimizing your DevOps processes, certain pairings of metrics are logical places to start.

DORA Metric: Change Failure Rate
Velocity Metric: Unreviewed Pull Requests
Change Failure Rate is the percentage of deployments causing a failure in production, while Unreviewed Pull Requests (PRs) refers to the percentage of PRs merged without review (either comments or approval).
How can you identify the possible causes of high rates of failures in production? One area to investigate is Unreviewed PRs. Code review is the last line of defense to prevent mistakes from making it into production. When PRs are merged without comments or approval, you’re at a higher risk of introducing errors into the codebase.
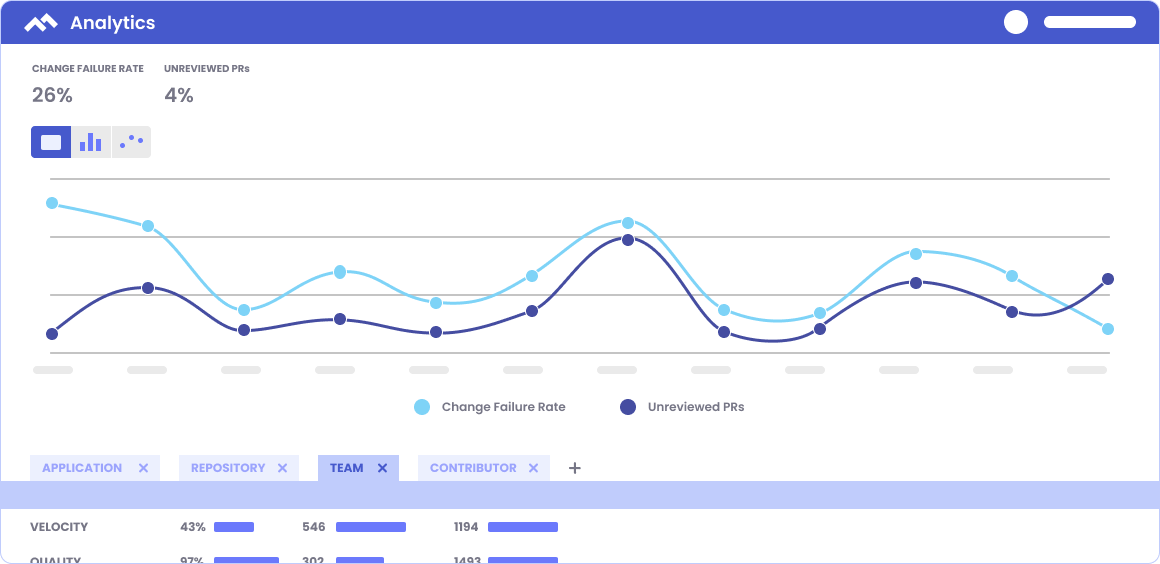
In Velocity’s Analytics module, choose Unreviewed PRs and Change Failure Rate to see the relationship between the two metrics. If you notice a high Change Failure Rate correlates to a high percentage of Unreviewed PRs, you have a basis for adjusting processes to prevent Unreviewed PRs from being merged.
Engineering leaders may start by coaching teams to improve on the importance of code review so that they make it a priority, and if necessary, setting up a process that assigns reviews or otherwise makes it more automatic. If you’re using Velocity, you can note the date of this change right in Velocity in order to observe its impact over time. You can take this data to your team to celebrate successes and motivate further improvements.
For reference, according to the State of DevOps report for 2022, high-performing teams typically maintain a CFR between 0-15%.

DORA Metric: Deployment Frequency
Velocity Metric: PR Size
Deployment Frequency measures how frequently the engineering team is successfully deploying code to production, and PR Size is the number of lines of code added, changed, or removed.
Our research shows that smaller PRs pass more quickly through the development pipeline, which means that teams with smaller PRs are likely to deploy more frequently. If you’re looking to increase Deployment Frequency, PR size is a good place to start your investigation.
If you view these two metrics in tandem and notice a correlation, i.e. that a larger PR Size correlates to a lower Deployment Frequency, encourage your team to break units of work into smaller chunks.
While this may not be the definitive solution for improving Deployment Frequency in all situations, it is the first place you might want to look. It’s important to note this change and observe its impact over time. If Deployment Frequency is still trending low, you can look at other metrics to see what is causing a slowdown. Within Velocity’s Analytics module, you also have the ability to drill down into each deploy to investigate further.
DORA Metric: Mean Time to Recovery
Velocity Metric(s): Revert Rate or Defect Rate
Mean Time to Recovery (also referred to as Time to Restore Service) measures how long it takes an engineering team to restore service by recovering from an incident or defect that impacts customers.
Debugging could account for a significant amount of the engineering team’s time. Figuring out specifically which areas in the codebase take the longest time to recover could help improve your MTTR.
In Analytics, you can view MTTR and Revert Rate or Defect Rate by Application or Team. Revert Rate is the total percentage of PRs that are “reverts”— changes that made it through the software development process before being reversed — which can be disruptive to production. These reverts could represent defects or wasted efforts (undesirable changes). Defect Rate represents the percentage of merged pull requests that are addressing defects.
By viewing these metrics side by side in the module, you can see which parts of the codebase have the most defects or reverts, and if those correlate to long MTTRs (low-performing teams experience an MTTR of between one week and one month).
If you notice a correlation, you can drill down into each revert, speak to the team, and see whether the issue is a defect or an undesirable change. To prevent defects in the future, consider implementing automated testing and/or code review. To prevent wasted efforts, the solution may lie further upstream. This can be improved by focusing on communication and planning from the top down.
DORA Metric: Mean Lead Time for Changes
Velocity Metric: Cycle Time
Mean Lead Time for Changes is the time it takes from when code is committed to when that code is successfully running in production, while Cycle Time is the time between a commit being authored to a PR being merged. Both are speed metrics, and can offer insight into the efficiency of your engineering processes.
Low performing teams have an MLTC between one and six months, while high-performing teams can go from code committed, to code running in production in between one day and one week.
If your team is on the lower-performing scale for MLTC, it could indicate that your Cycle Time is too high or that you have issues in QA and testing. View these metrics in tandem in Velocity in order to check your assumptions. If your Cycle Time is high, you can dig deeper into that metric by investigating corresponding metrics, like Time to Open, Time to Merge, and Time to First Review.
Conversely, if your Cycle Time is satisfactory, the problem could lie with deployments. You should investigate whether there are bottlenecks in the QA process, or with your Deploy Frequency. If your organization only deploys every few weeks, for example, your team’s PRs could be merged but are not being deployed for a long time.
The power of DORA metrics in Analytics
DORA metrics are outcome-based metrics which help engineering teams identify areas for improvement, yet no single metric can tell the whole story of a team’s performance. It’s important to view DORA metrics with engineering metrics to gain actionable insights about your DevOps processes.
To learn more about using DORA metrics in Velocity, talk to a product specialist.
Get articles like this in your inbox.
Trending from Code Climate
1.
Engineering Leaders Share Thoughts on Leadership in Disrupted Times in a New Survey
For engineering teams, disruption to the business can have a significant impact on the ability to deliver and meet goals. These disruptions are often a result of reprioritization and budget changes on an organizational level, and are amplified during times of transition or economic instability.

2.
Built In’s 2023 Best Places to Work — Why Code Climate Made the List
At Code Climate, we value collaboration and growth, and strive for greatness within our product and workplace. For us, this means fostering a supportive, challenging, people-first culture. Thanks to an emphasis on these values, we’ve earned spots on three of Built In’s 2023 Best Places to Work awards lists, including New York City Best Startups to Work For, New York City Best Places to Work, and U.S. Best Startups to Work For.

3.
Turnkey Deployment Delivers Day-One Value for Yottaa
Learn how Yottaa gained immediate value from Code Climate Velocity right out of the box.

Get articles like this in your inbox.
Get more articles just like these delivered straight to your inbox
Stay up to date on the latest insights for data-driven engineering leaders.

